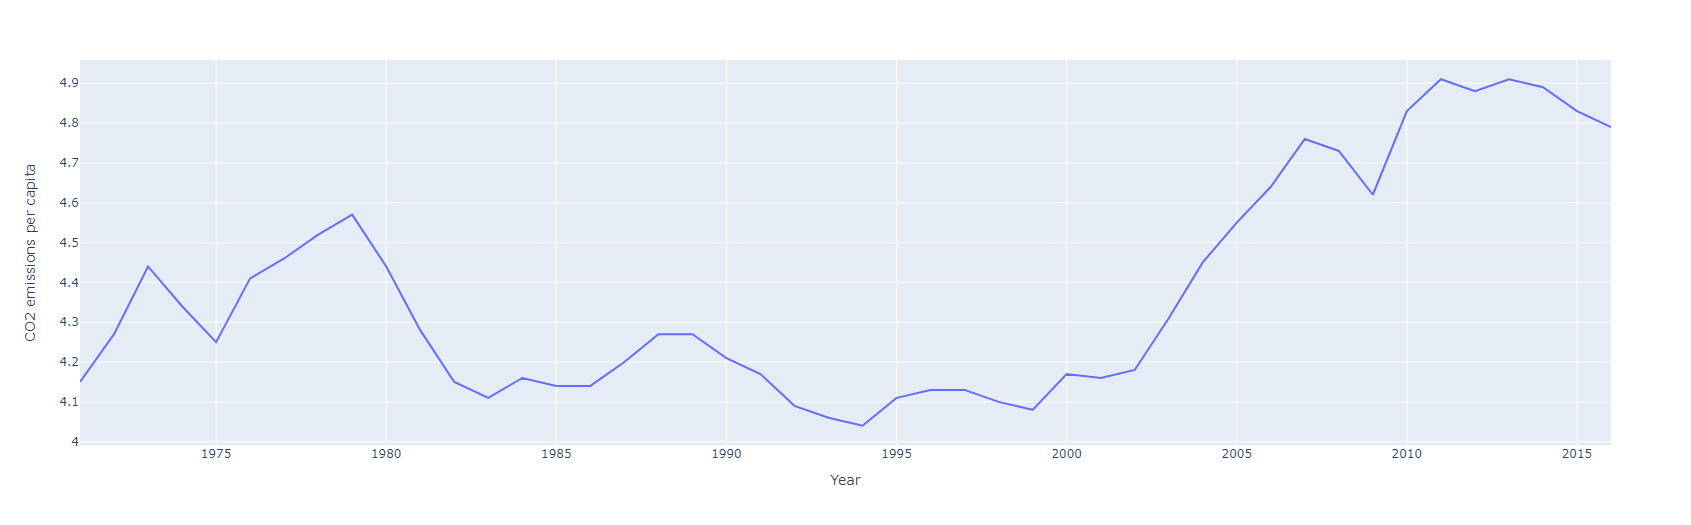
Carbon dioxide, one of the greenhouse gases, has been concentrating in the atmosphere due to anthropogenic activities. The global concentration has increased from 280 ppm in the pre-industrial era to 379 ppm in 2005. A trend analysis of carbon dioxide emission between 1974 and 2016 visualises global scenario. Chart below reveals significant decrease of per capita carbon dioxide emission between 1985 and 2000 however higher levels of per capita can be observed between 2011 and 2013. Time series chart shows trend of other parameters including population and population change within the past 40 years.

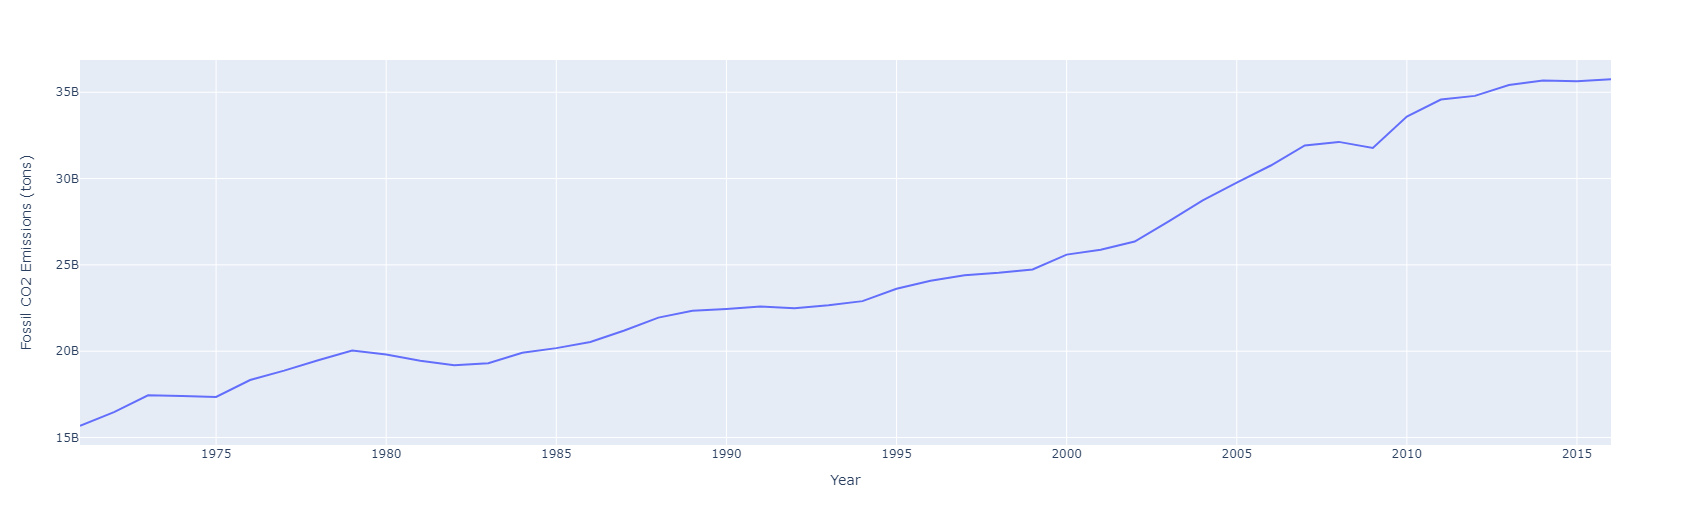
Graph below reveals a linear trend of increase in fossil fuel carbon dioxide emission within the past 40 years.
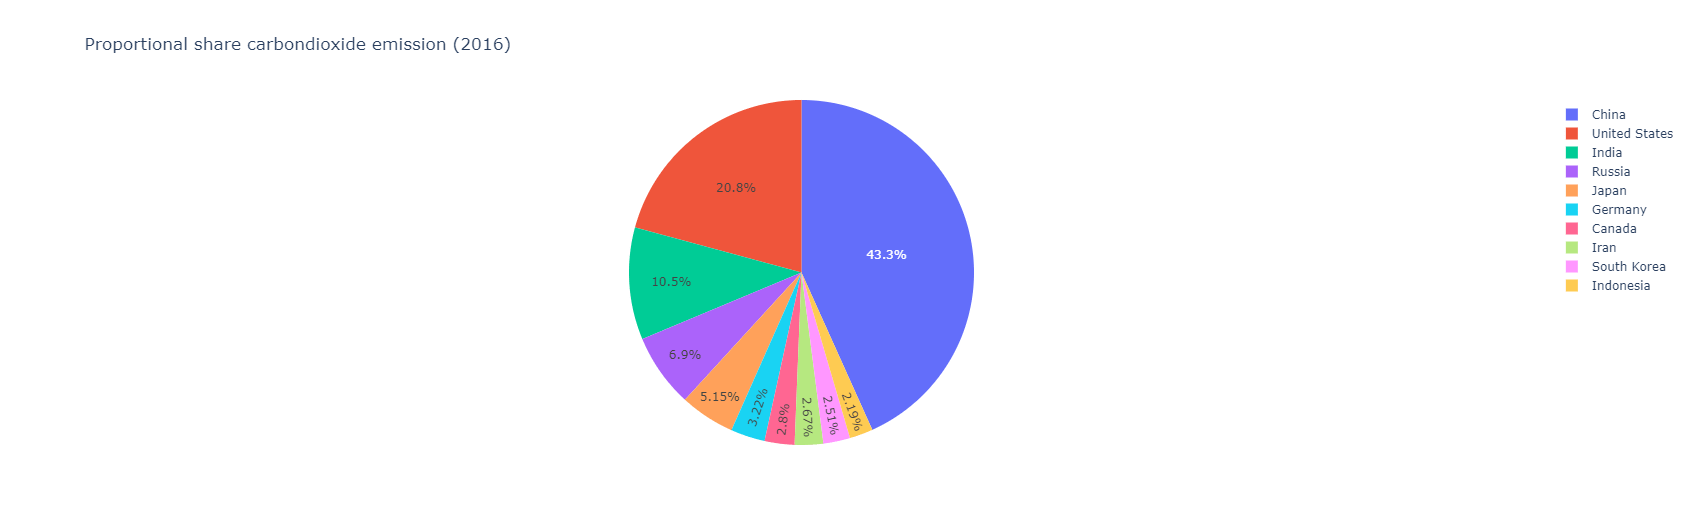
In 2016, China shares the highest proportion of carbon dioxide emission (43.3%), followed by US 20.8%) and India (10.5%).
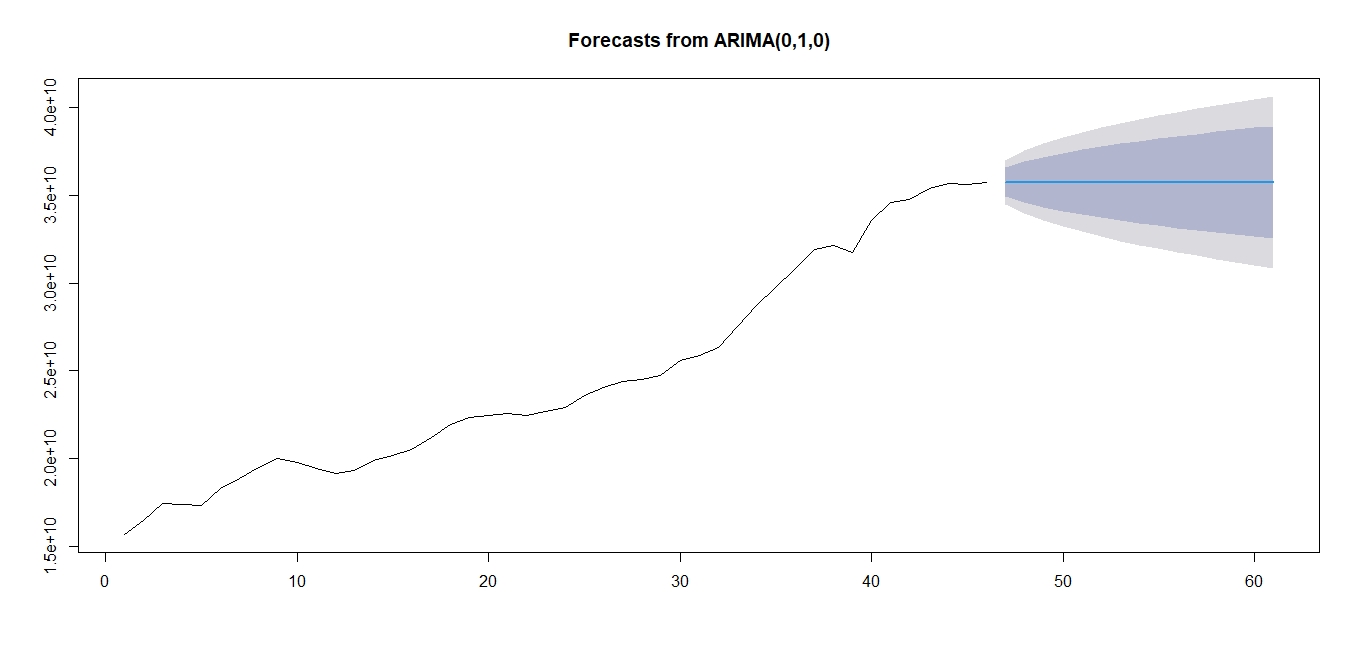
Autoregressive Integrated Moving Average(ARIMA) model based forecast is plotted in the figure below where y axis is value of fossil fuel carbon dioxide emission and x axis is the number of years since 1971.
Source of Data: http://www.worldometers.info
Software: Excel, R, Python.

Leave a Reply